Supermetrics, the best reporting tool for advertisers
Before thoroughly reviewing what it is Supermetrics Let's review some of the downsides of the current landscape when creating reports.
As advertisers, we are always looking for the best reporting tool that works well across channels, has comparative dashboards, and is flexible enough to generate custom reports.
The reporting saga
Let's say your goal is to measure everything, make a report and obtain important information from your measurements. Easier said than done. What happens more than usual when creating reports is that the process of tracking nuances and joining data becomes very complex and some tools only display a portion of the information you need. Not to mention that you still have to do the optimization process for your campaigns.
Create effective reports
To make effective reports, you must establish clear objectives for each campaign. This requires defining each step or series of steps in a funnel, then measuring and isolating specific events.
Event tracking or system structures may not be perfect, so I recommend that you verify that the key steps in your funnel are triggered correctly for your main channels.
I also recommend that you don't get overwhelmed by the number of metrics available and don't wear yourself out creating overly elaborate dashboards that tell you everything. It is preferable that you analyze the performance of your actions based on the panels of the advertising platform from which you want to obtain information, as long as you understand the nuances of attribution.
Note: Keep in mind that each ad platform works with a different set of priorities when it comes to displaying information. The structures of the systems must be configured correctly so I recommend that you take your time to implement it. However, since you probably don't always have the time to wait for your company's internal teams to prioritize their marketing inquiries, I recommend that you set up a well-organized metrics and events funnel. In this way, your campaigns will not be held back by other priorities of your team.
Take advantage of the data you really need
One of the main goals you should have when managing an account is to extract micro and macro indicators that translate into important actions and then use them to build a funnel. Doing this effectively means ignoring irrelevant metrics to reduce noise. Either way, you can always visit the source to review more metrics if needed.
The main indicators consist of:
- Platform metrics (Facebook, Google Ads)
- User behavior (Google Analytics, Heal, Mixpanel)
- Compliance with objectives on your site such as adding products to the cart, through Google Analytics.
- Conversions such as purchases or obtaining leads through Facebook Ads, Google Ads, Google Analytics, Heap, Shopify, Mixpanel, Salesforce or Pipedrive.
The question is to determine what is the best way to obtain data for your reports. If you want to build a board, Data Studio is a very good option. In this way you can mix graphs and tables that make it easier for you to organize your information.
In the same way, you can also determine if you want to work with the raw data from spreadsheets. However, an excellent tool for collecting and analyzing your data is Supermetrics.
Supermetrics
This tool is especially good for organizing data in an easy way, since it gives you the possibility to determine how, when and where to obtain the data to assemble your reports effectively.
With Supermetrics You can obtain information from your reports in Google Sheets, Excel, Data Studio or through the new Big Query connector.
Who should use Supermetrics?
This tool is especially useful for PPC advertisers. However, Supermetrics it's also a great tool for SEO specialists, content creators, social media advertisers, customer service teams, product teams, and BI teams. This is because the tool allows you to obtain ad hoc information for both your internal projects and those of your clients.
Depending on what you want to do with the data obtained from your reports, you have a specific product for you to select, within which you will find:
- Supermetrics for Google Sheets
- Supermetrics for Google Data Studio
- Supermetrics API
- Supermetrics for BigQuery
- Supermetrics for Excel
- Supermetrics Uploader
If you want to know the complete list of templates click here.
Introduction to Supermetrics
Below I will show you a brief description of some of the Supermetrics products mentioned above, with a short guide so you know how to apply them.
To find out which product you should use, I recommend that you evaluate the tool that is most efficient for you when analyzing your data. For this, you have a free 14-day trial in which you can explore which product works best for you.
Supermetrics for Google Sheets
With this tool you can obtain data for your reports and download them in Google Sheets. If you are used to using spreadsheets to create your reports, this is an excellent option.
There you can obtain data from one or more sources, as well as schedule the creation of reports that include graphs and tables. This information can be updated every hour, day or week and you can configure an alert system that will arrive directly to your email.
In addition to obtaining information from the different reporting platforms, you can also connect Big Query and obtain information directly from your custom BI database.
Because the data you obtain in Google Sheets can be segmented, you can filter and divide your information in different ways, and then link this data with Data Studio as your source for your information.
Using Google Sheets is an excellent option, however if your databases have more than 10,000 rows, I recommend that you use Excel.
Get the report template for Google Sheets here.
Quick setup guide
Note: This example is designed to obtain data using Google Chrome on a Macbook Pro.
- Go to https://supermetrics.com/product/google-sheets
- Click on “Start Free Trial”

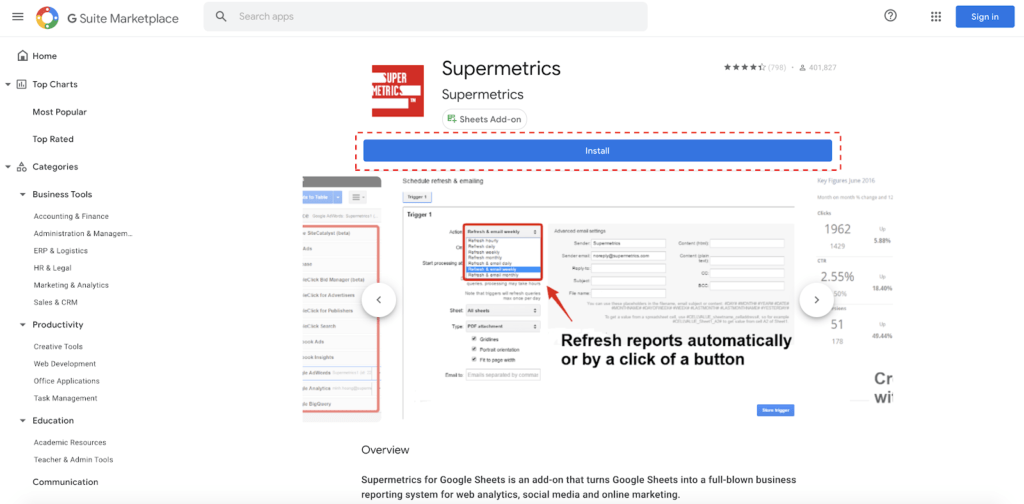
This action will take you to the G Suite application portal. Click install.

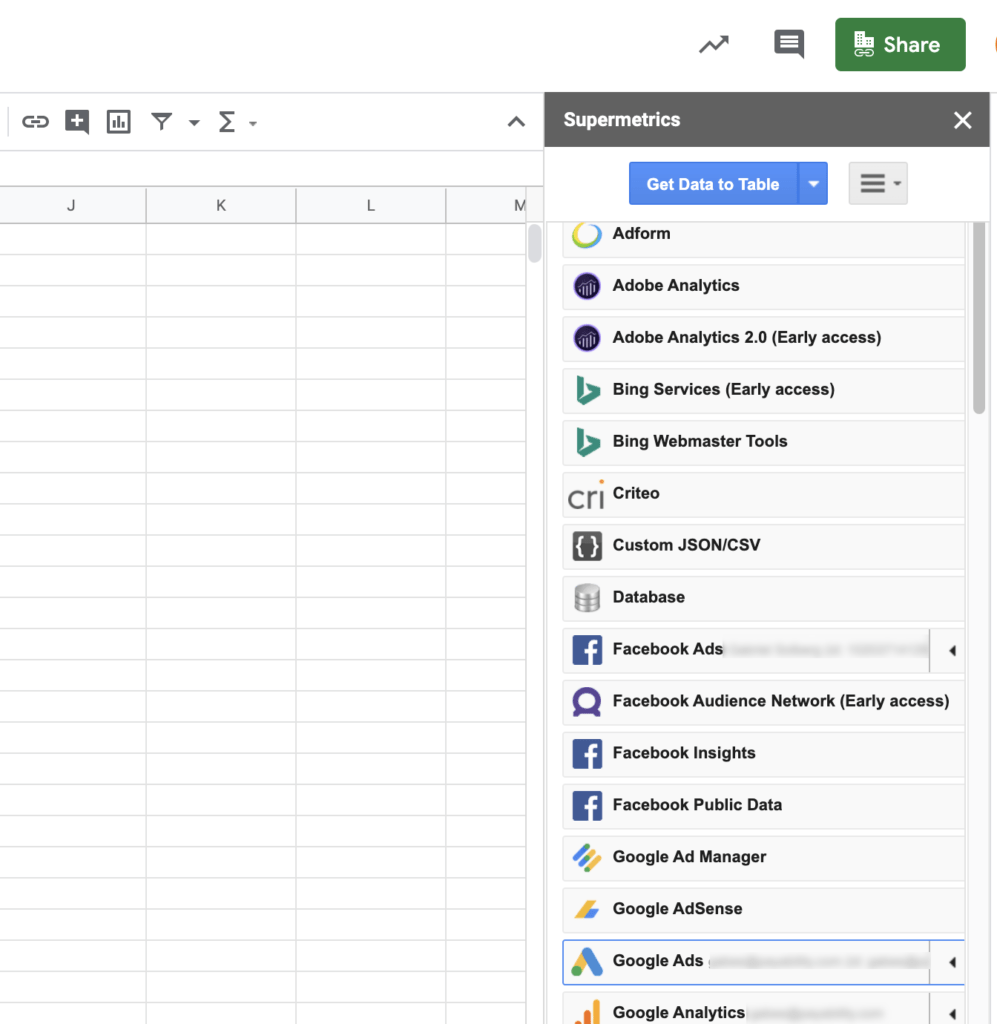
Once installed, go to a blank Google Sheets page and click Add-ons> Supermetrics> Launch

Now you can access all the settings from this panel.

Supermetrics for Google Data Studio
If you want to get your information directly into Google Data Studio to view your reports, this Supermetrics connector will be very useful. I recommend that you use it in conjunction with Big Query as it works very well with Data Studio. Additionally, you can download all your information in Google Sheets through third-party platforms and then dump this data in Google Data Studio.
Quick setup guide
- Go to https://supermetrics.com/product/data-studio
- Start your free 14-day trial.

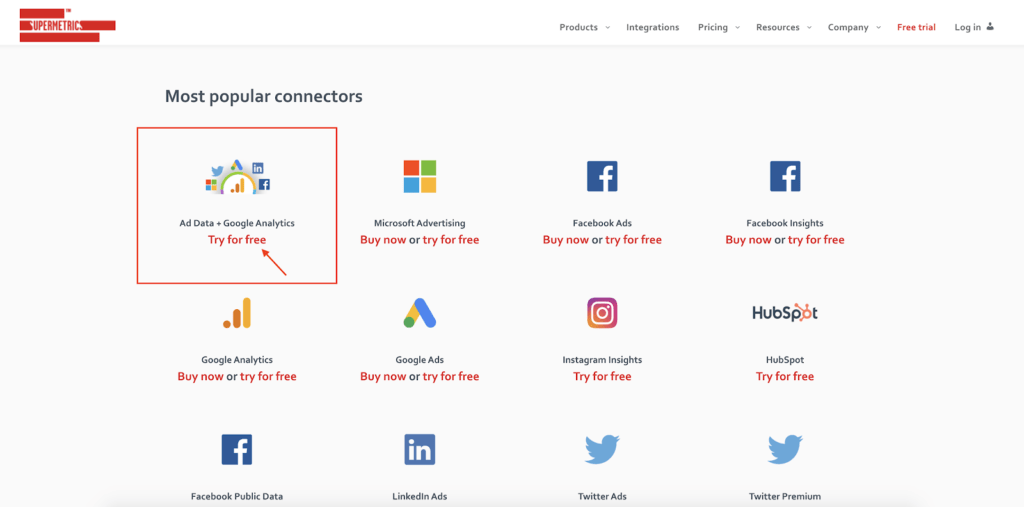
- Then select the connector you need. In this case, you should search for "Ad Data" + Google Analytics, which includes the most popular platforms. However you can add or remove connectors according to your reporting needs.
Below I show you some of the sources from which you can obtain your data.
Facebook Ads
Google Ads
Microsoft Advertising (Bing)
Twitter Ads
LinkedIn Ads
Google analytics
- Click on “Try For Free”.

Then you must authorize the use of this connector.

Accept the necessary permissions for the installation by clicking “Allow”.

Once you have authorized the use of the connector, you must also authorize the use of each specific platform by entering your user data in each of them.

Supermetrics for Excel
This procedure is very similar to what you would do to use Google Sheets, with the difference that you are going to download your data in Excel. This application has the same number of integrations as Google Sheets, with the difference that you can work with much more robust databases.
Quick setup guide.
- Click on https://supermetrics.com/try-excel and start your free trial.

Select the online or desktop version depending on how you use Excel. I recommend that you use the version for computers since as I mentioned before, this option is especially useful for large databases.

Once you've clicked "Start Trial for Computers," click Open in Excel on the next page.

This action should open Excel on your computer. Then you must enable editing and give Excel permission to use the application.

You can access this add-on in the "Insert" tab under the name "My Ad-ins"

From that moment you can access the settings in the side panel on the right, just like in Google Sheets.

Another way to get this plug-in is in the Microsoft application and click "Get Now."

Automatic Uploader
If you want to obtain cost data from all your channels in Google Analytics, you can use the automatic uploader (Automatic Uploader) which allows you to configure the process of obtaining information in advance. This way is similar to obtaining data from Google Ads in Google Analytics.
The charger is similar to EasyAutoTagging. However, you can submit cost data assigned to the UTMs of your Facebook ads to analyze your cost information at the source, medium, campaign, and content level.
Quick setup.
- Go to https://supermetrics.com/product/supermetrics-uploader and click "Use Uploader".

Log in to your Google account associated with your Google Analytics account.

Then choose your type of charger.

Connect your Facebook account, filter the specific campaigns and define your currency in the “Upload Source” section. In the same way, you must choose the source of your data in the "Upload Target" section.

Conclution
Sometimes making reports is not an easy task and the information you are looking for moves quickly just like the entire digital environment. As a result, it is very important to have a tool that adapts to different workflows. That's why this is Supermetrics It is my recommendation so that you can easily obtain the information you are looking for and that you can make your reports efficiently.