Google Data Studio updates
Since its launch, Google has updated Data Studio with new tools, the latest ones in general are focused on providing better opportunities to visualize data, as well as having integrated data sources in an easier way.
Let's see some of the most interesting news in recent months. It seems to me one of the most complete tools on the market to visualize results in a comprehensive way.
Update in Search Console connector
The new Search Console connector allows you to select 16 months of data. This is very useful, especially when looking to identify different trends or compare performance between different years.
Supermetrics offers an updated version of Data Studio for the Search Console connector. Now you can differentiate between brand and generic search queries, you can also precisely control your data and save historical information to select a time range greater than 16 months.
Join data from multiple sources in one place
Have you ever wanted to see information from Google Analytics, Google Ads or similar platforms in Data Studio? The possibility of unifying data brought from different sources (data blending) in a single graph is now possible and allows for more comprehensive and useful reports. For example, if you are trying to see which channels are performing better than others, or perhaps more effective time ranges than others, this tool will surely help you a lot.
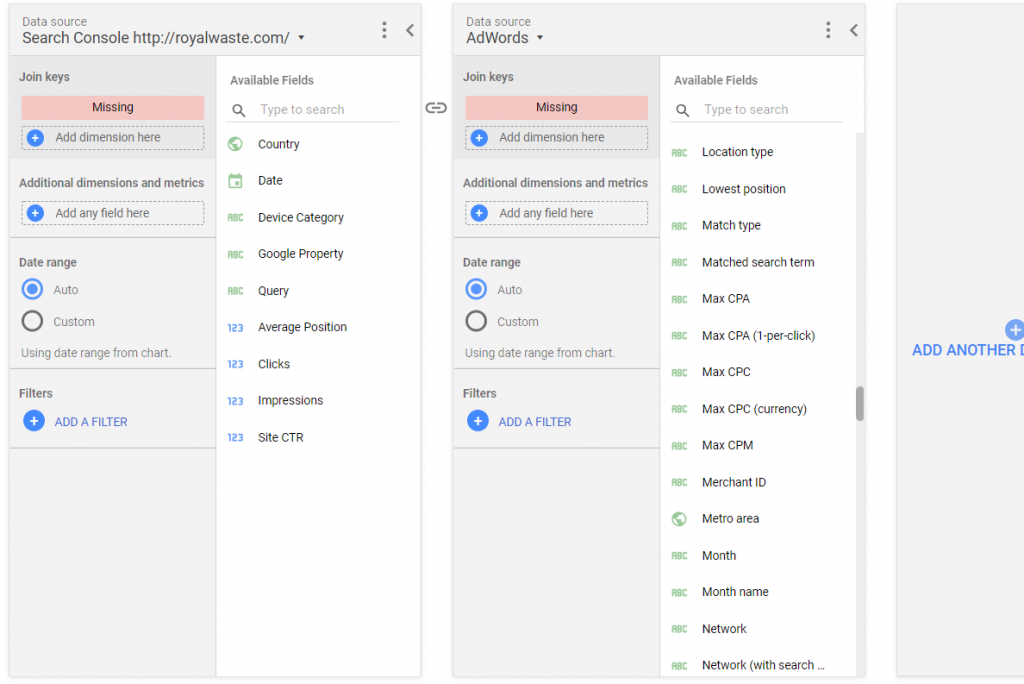
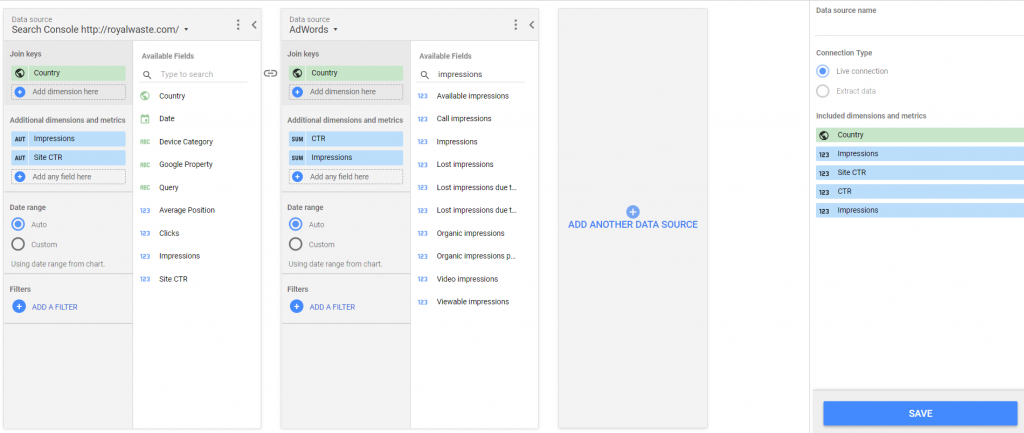
It is important to mark in order to use this tool, the different fonts must have at least one dimension in common, this is known as the "combination key".
It is also good to note that you can only mix the information in the reports, so this will not be shown in the "data sources" section, so if you are trying to find the data sources in the respective section, you will not find them. . This can be a bit confusing at first, but you'll quickly get used to it later.
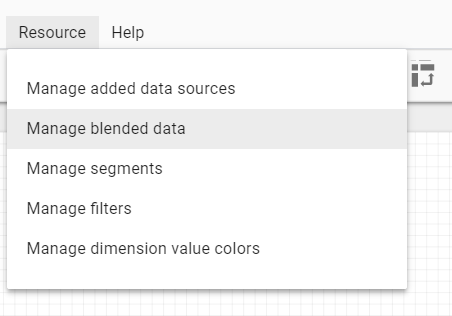
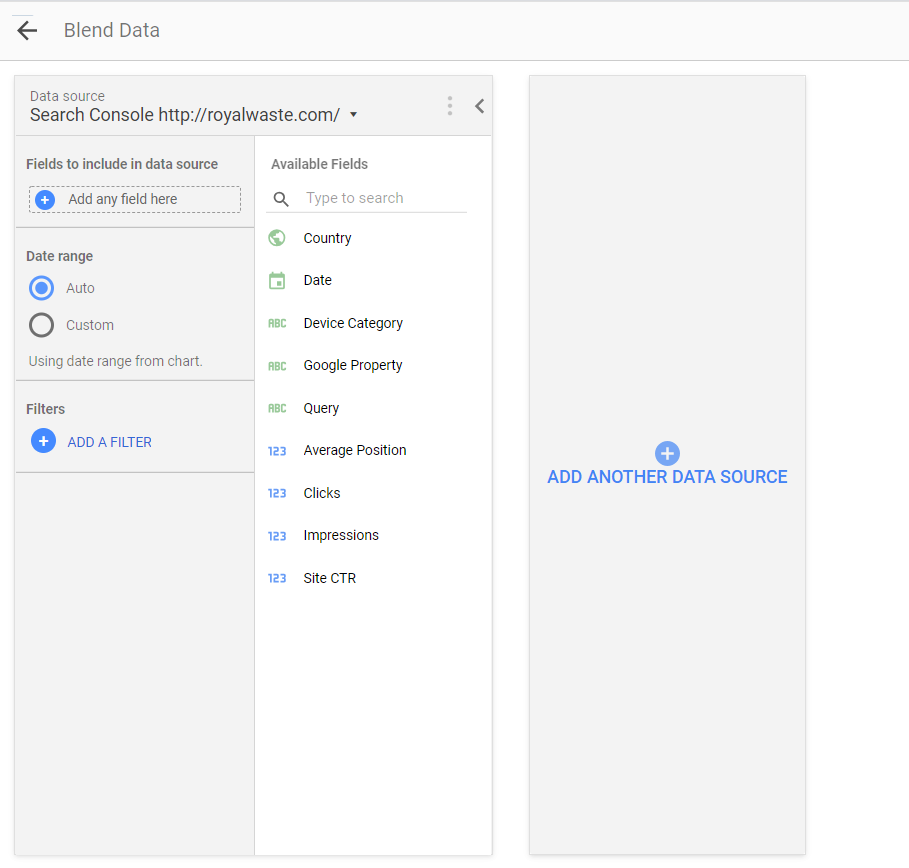
To start mixing data, we can create a new report or open an existing one.


Add your second data source. At least one dimension must be included to function as a join key.


Once the combination keys have been selected, the information can be saved and added to the reports in order to generate graphs.
One recommendation, be sure to pay attention to the help guides in the initial setup, there is a learning cup to do this and it may take a try or two to get it right.
How to get the most out of data combinations.
Surely you wonder how you can use the information you have in the best way. An initial idea may be to compare the performance of different sub domains. Many specialists use subdomains for marketing purposes, but it can be interesting to compare the effectiveness of the main site with respect to the subdomains. In Data Studio you can select the two types of data and compare them.
In this way you can determine how effective a landing page is, as well as you can compare the different landing pages with each other to see which one is working better.
You can also select information from email platform sources, the data source of your email marketing platform can include clicks, open rates, etc.
To this you can add information from Google Analytics to see the behavior across the site, and in this way compare how the different landing pages and messages affect the actions of potential customers.
Try mixing information from different supermetrics connectors in order to have more Insights from your data.
Share your reports in Data Studio
Another important tool is the ability to share your Google Data Studio reports on social networks or by chat. This used to be very difficult to do, but now these reports can be distributed on any platform that supports the Open Graph Protocol. That is, you can share them on some of the following platforms:
- Google+
- Slack
- Hangouts
- iMessage
It is very easy to share them, you just have to copy and paste the URL of the report and you will see a screenshot of it, along with the title and description.
All these updates represent facilities not only to analyze our information and be able to see it in a 360 way, but also to simplify the way in which we share our data. Working with data analytics can sometimes be a bit cumbersome, and Google, as well as Supermetrics, allow us to make this a much less complex task.
Have you already tried any of these tools? Tell us what you think.